“It’s about the Jimmys and the Joes, not the X’s and the O’s” -Coach Darrell Royal
Introduction: The Underdog’s Edge
As head coach of both the U.S. Cyber Team and Marshall’s Cybersecurity squad, I’ve leveraged data-driven analytics to win both national and international titles in cybersecurity/CTF competitions. Recently, I came up with the mad-science idea of “Can I use some of the same modeling concepts to potentially predict and possibly win a college football game?” As Texas’s Darrell Royal once said “It’s about the Jimmy’s and the Joe’s, and not the X’s and the O’s.” Well, in this case I wanted to see if I could indeed mix both the “Joe’s and the O’s” and create a predictive gameplan that could be shown to be a winner. Even in my field, data-driven analytics has transformed gut-feel decisions into a precision science. Every snap, formation, and personnel grouping becomes a set of metrics—run-pass splits, yards per play, coverage success—that feed machine-learning models uncovering hidden edges. Blue-blood programs once hoarded these tools; today, advances in automation hand the same toolkit to underdogs.
Entering Week 1 of the 2025 season, Marshall faces daunting odds against top-ranked Georgia in Athens. Sportsbooks (asof the writing of this post) currently list Marshall as a 39.5-point underdog, with a moneyline of +3000, implying a 3.23% chance of victory. This projection mirrors the kind of lopsided expectations seen in Marshall’s 2024 matchup against Ohio State, which ended in a 49–14 defeat. However, as this post explores, an data-driven strategic blueprint—validated through coaching-adjusted simulations—suggests a much narrower competitive gap is possible and increases the porbability of victory to close to a 26% chance of victory. In other words, the data tells a different story.
For this experiment I apply a four-pillar pipeline of data ingestion, feature engineering, predictive modeling, and decision scripting—to craft a quarter-by-quarter game plan that puts Marshall in position to upset an elite SEC football team in hostile Sanford Stadium in Week 1 of 2025.
AI Analytics Pipeline — Turning Raw Data into Play-Calling Precision
This section outlines the four-stage AI pipeline that transforms raw football data into actionable, quarter-by-quarter game plans. Think of it as a play-calling assistant that learns from past games, simulates future ones, and scripts decisions in real time.
Data Acquisition
Gather every piece of structured and unstructured data that could influence a game. In this case it’s worthy to note that it’s the first game of the season for both teams so rosters are fairly predictable as of the writing of this post:
- Rosters & Depth Charts: Who’s starting, who’s injured, who’s transferring in or out.
- Play-by-Play Logs: Every snap from previous seasons, including down, distance, formation, and result.
- Spring Practice Reports & Transfer Portal Metrics: Early indicators of player development and scheme changes.
📌 Goal: Scrape rosters and build a comprehensive dataset that reflects both team tendencies and individual capabilities.
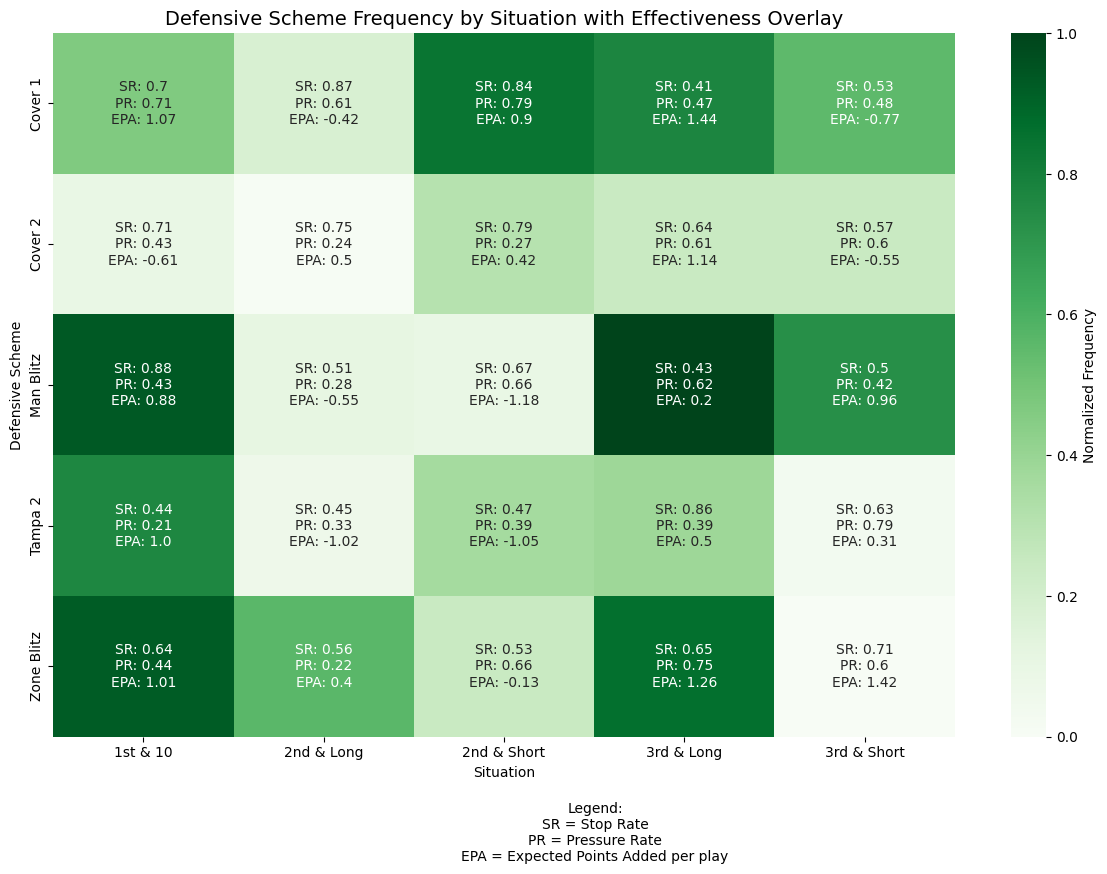
Feature Engineering
Tag and transform the data into features that machine learning models can understand:
- Tagging: Label each play with metadata like down, distance, quarter, formation, personnel grouping, and field position.
- Derived Metrics:
- Run-pass ratios
- Yards per play
- Success rate
- Expected Points Added (EPA)
📌 Goal: Convert raw data into meaningful variables that capture the DNA of each team’s strategy.
Predictive Modeling & Simulation
Use machine learning to forecast outcomes:
- Clustering: Group similar formations and personnel packages using K-Means.
- Classification: Predict next play calls using Gradient Boosting based on game context. It’s worthy to note here that both Tony Gibson (Marshall) and Kirby Smart (Georgia) have nearly a decade of defensive coordinator tendencies that can be fed into this model.
- Monte Carlo Simulation: Run thousands of simulated drives to estimate scoring probability, time of possession, and field position.
📌 Goal: Forecast how different play-calling strategies will perform under various game conditions.
Leveraging the 2025-2026 Rosters
To build a matchup-aware game plan, I began by scraping and structuring the 2025–26 rosters for both Marshall and Georgia. Again, this is fairly predictive since this is the first game for both teams. However, this can be done from week-to-week to account for injuries, breakout players, and roster attrition. For the first game, this process (especially for Marshall) involved multiple data sources and custom parsing logic:
Data Sources
- Official Team Websites: Depth charts, player bios, and spring practice updates.
- Transfer Portal Trackers: Verified incoming and outgoing transfers.
- Recruiting Databases: 2026 commits and early enrollees from sites like 247Sports and On3.
- Game Logs: Historical performance data from 2024 and early 2025 seasons.
Scraping Methodology
- Python Scripts with BeautifulSoup & Requests: Used to extract structured HTML tables and player metadata.
- Regex Parsing: Cleaned and normalized inconsistent formats (e.g., position abbreviations, height/weight units).
- Data Validation: Cross-referenced player names, positions, and eligibility with multiple sources to ensure accuracy.
- Automated Updates: Scheduled scripts to re-scrape weekly during fall camp to capture depth chart changes and injury reports.
Roster Structuring
Each player was tagged with:
- Position group (QB, RB, OL, DL, etc.)
- Experience level (returning starter, transfer, freshman)
- Physical metrics (height, weight, speed scores)
- Performance indicators (yards, tackles, sacks, INTs, etc.)
- Scheme fit (e.g., zone vs. man coverage tendencies, run-blocking grade)
📌 Goal: Create a matchup matrix that aligns Marshall’s personnel strengths against Georgia’s defensive tendencies and vice versa.
This structured roster data fed directly into the feature engineering and simulation stages of the pipeline, allowing for matchup-specific play-calling and scripting.
Marshall enters the season with a somewhat veteran offensive line (even through transfer portal acquistions), a downhill running back duo, and a mobile quarterback. The defense features experienced edge rushers and a ball-hawking secondary.
Georgia counters with a balanced offensive attack, athletic edge defenders, and a deep secondary rotation. Their incoming talent includes several high-profile recruits and transfers across the defensive front and skill positions.
Matchup Overview:
- Marshall’s physical front vs. Georgia’s athletic nickel packages
- Power run game vs. fresh edge defenders
- Seam route potential against rotating safeties
It doesn’t take data analytics or AI here to determine that Marshall is at a massive disadvantage when it comes to the talent stack of Georgia (The Jimmies). This is not the point of the roster scrapting and comparison. The idea is to find the strengeths of the inferior team (Marshall), and use those strengths for data analytics/AI to build further gameplan from. We’ll discuss this later on…
Translating Coaching Tendencies to 2025 Context
Rather than relying on Marshall’s 2024 play-calling data—which reflected Charles Huff’s philosophy—I recalibrated the model to reflect the strategic DNA of Marshall’s new coaching staff and Georgia’s 2024 coordinators. This ensures the simulation engine mirrors how the team is likely to operate in 2025, not how it played last season.
Marshall Coaching Profile: 2025 Predicted Coaching Tendencies
Offensive Blueprint: Rod Smith (Jacksonville State)
Rod Smith’s offenses at Jacksonville State were built around a physical, tempo-driven spread system. His play-calling leaned heavily on the run, but with modern RPO and motion elements that stress defenses horizontally and vertically.
Key Traits Modeled:
- Run-pass ratio: ~60% run / 40% pass
- Shotgun-heavy formations with stacked WRs and motion
- Inside zone, power read, jet sweep RPOs, and vertical seams off play-action
- Frequent no-huddle clusters and scripted drive openers
These traits were extracted from JSU game logs and encoded into the simulation engine to reflect how Marshall’s offense will likely operate under Smith.
Defensive Blueprint: Tony Gibson (NC State)
Tony Gibson’s 3-3-5 stack defense at NC State is known for its aggressive blitzing and post-snap disguise. His units consistently ranked among the ACC’s best in third-down defense and red-zone efficiency.
Key Traits Modeled:
- Base 3-3-5 stack with hybrid safeties
- High blitz frequency on 2nd-and-long and 3rd-and-medium
- Quarters and cloud coverage with post-snap pattern matching
- Pre-snap two-high looks that rotate into man or zone blitzes
These defensive patterns were modeled to simulate how Marshall might counter Georgia’s offensive strengths, particularly in passing downs and red-zone situations.
Defensive Coordinator Layer: Shannon Morrison
As the new defensive coordinator, Shannon Morrison adds nuance to Marshall’s defensive strategy. His past work emphasizes situational disguise, hybrid linebacker usage, and zone rotation—complementing Gibson’s aggressive philosophy (at least this is what game trends show).
Modeling Considerations:
- Situational sub-packages (e.g., dime with hybrid LB/S roles)
- Delayed blitzes and zone rotation
- Emphasis on third-down disguise and red-zone containment
As Morrison’s role becomes clearer during fall camp and early-season games, the model can be updated to reflect his influence on coverage shells and blitz timing.
Opponent Profile: Georgia’s 2024 Coaching Tendencies
Kirby Smart – Strategic Philosophy
Kirby Smart sets the tone for Georgia’s discipline-first, situationally elite football. His teams emphasize controlling the line of scrimmage, minimizing risk, and forcing opponents into predictable downs.
- Emphasis on field position and red-zone efficiency
- Conservative early-down play-calling
- High coaching intensity and adaptability
Glenn Schumann – Defensive Coordinator
Schumann’s 2024 defense remained elite despite roster turnover:
- 4-2-5 nickel base with hybrid linebackers and rotating safeties
- Top 5 nationally in third-down defense (25.7%)
- No. 2 nationally in red-zone scoring prevention (67.6%)
- Frequent post-snap rotation and delayed blitzes
📌 Edge Modeling: Schumann’s fourth-quarter dominance and third-down disguise tactics are key variables in scripting Marshall’s tempo and red-zone sequences.
Mike Bobo – Offensive Coordinator
Bobo’s 2024 offense saw a statistical dip despite returning talent:
- Total offense: 405.4 yards/game (No. 51 nationally)
- Rushing offense: 124.4 yards/game (No. 102 nationally)
- Heavy reliance on shotgun and play-action
- Preference for intermediate passing and tight end seams
- Reduced explosive play rate compared to 2023
📌 Edge Modeling: Bobo’s predictable sequencing and reduced run efficiency create opportunities for Marshall’s disguised blitzes and tempo disruption.
Future Model Adaptation
Once Rod Smith, Tony Gibson, and Shannon Morrison settle into their roles at Marshall and establish their 2025 play-calling identities, the model will be retrained using:
- Live play-by-play data from Marshall’s first 3–4 games
- Practice reports and depth chart shifts
- In-game situational tendencies (e.g., 3rd-down blitz rates, red-zone play selection)
- Wearable telemetry and fatigue metrics (if available)
📌 Goal: Build a living model that evolves with the team, adapting to real-time coaching decisions and opponent adjustments.
Matchup Edge: Where Scheme Meets Opportunity
By modeling Marshall’s 2025 strategy around Rod Smith’s tempo-driven spread offense and Tony Gibson’s aggressive 3-3-5 defense—complemented by Shannon Morrison’s situational disguise—the simulation identifies several key matchup advantages against Georgia’s 2024 coaching staff led by Kirby Smart, Glenn Schumann, and Mike Bobo.
Offensive Edge: Tempo vs. Defensive Rotation
- Georgia’s 2024 defense under Glenn Schumann relied heavily on rotating safeties and hybrid linebackers in its 4-2-5 nickel base.
- Rod Smith’s no-huddle clusters and motion-heavy RPOs force defenders to declare early and limit substitution windows.
- Inside zone and jet sweep RPOs target Georgia’s edge defenders before they can set leverage, especially in tempo sequences.
📌 Edge: Marshall’s tempo and motion stress Georgia’s defensive rotation and alignment discipline.
Defensive Edge: Disguise vs. Predictability
- Georgia’s offense under Mike Bobo was statistically its weakest under Smart, with a predictable reliance on shotgun play-action and tight end seams.
- Tony Gibson’s post-snap pattern matching and disguised blitzes are designed to confuse quarterbacks reading coverage pre-snap.
- Shannon Morrison’s influence adds hybrid linebacker/safety looks that can bait throws into disguised zones and rotate coverage shells post-snap.
📌 Edge: Marshall’s disguised coverage and blitz timing can disrupt Georgia’s rhythm and force low-EPA decisions.
Situational Edge: Red Zone & Third Down
- Georgia’s red-zone efficiency remained strong, but its third-down conversion rate dipped in 2024.
- Marshall’s defensive model emphasizes red-zone containment and third-down disguise, using delayed blitzes and cloud coverage.
- Offensively, Rod Smith’s play-action seam and shovel-draw RPOs are tailored for red-zone spacing and misdirection—ideal for attacking Schumann’s late-down disguise packages.
📌 Edge: Marshall’s situational scripting counters Georgia’s strengths in high-leverage downs.
By aligning Marshall’s emerging identity with the known tendencies of Georgia’s 2024 squad, the model identifies specific leverage points—tempo, disguise, and situational control—that can be exploited to engineer an upset.
Quarter-by-Quarter Game Plan
Now here’s where it gets fun…
This section outlines a high-level, quarter-by-quarter strategy designed to exploit the matchup edges identified in Section 3—tempo vs. rotation, disguise vs. predictability, and situational control. But this isn’t just theory.
Behind the scenes, this game plan is powered by a custom-built AI model that leverages all the data collected in previous sections—from coaching tendencies and roster matchups to formation usage and drive efficiency.
Using a combination of Python-based tools, the model can generate a play-by-play breakdown tailored to specific game scenarios. Here’s how it works:
- Monte Carlo simulations estimate scoring probabilities across thousands of drive sequences.
- Gradient Boosting classifiers predict optimal play calls based on down, distance, score, and field position.
- YAML-based scripting language defines formations, personnel groupings, and situational packages.
- Markdown and PDF generators output coach-friendly play sheets and call sequences for each quarter.
This is merely an overview of the quarter-by-quarter strategy. However, it can be exploded out to a drive-by-drive strategy if need be.
1st Quarter: Controlled Chaos
- Offensive Approach: Begin with a scripted 12–15 play sequence emphasizing RPOs, boundary throws, and motion to manipulate Georgia’s linebackers. Use tempo variation to prevent defensive substitutions and test Georgia’s early alignment discipline.
- Defensive Approach: Deploy base 3-3-5 with disguised coverages. On 2nd-and-long, shift into simulated pressure looks and overload blitzes from the field side. Rotate safeties post-snap to confuse pre-snap reads.
- Situational Goal: Control possession, limit Georgia’s early explosive plays, and create discomfort in their offensive rhythm. A 7–3 or 10–7 scoreline in either direction is acceptable if tempo and control are established.
2nd Quarter: Situational Leverage
- Offensive Approach: Introduce vertical route concepts off play-action, especially from condensed formations. Target Georgia’s safeties with layered route trees and isolate their STAR defender in coverage using motion and bunch sets.
- Defensive Approach: Increase front rotation and use delayed blitzes to disrupt Georgia’s timing. Emphasize third-down disguise and red zone containment.
- Situational Goal: Flip field position, steal a possession via turnover or fourth-down stop, and enter halftime within one score. Use analytics to guide fourth-down decisions inside Georgia territory.
3rd Quarter: Tempo and Turnovers
- Offensive Approach: Accelerate tempo immediately after halftime. Use motion to create mismatches and attack Georgia’s linebackers in space. Introduce misdirection and counter concepts to exploit over-pursuit.
- Defensive Approach: Increase blitz frequency and force quick throws. Emphasize takeaway opportunities with trap coverage, zone rotation, and aggressive pursuit angles.
- Situational Goal: Generate explosive plays and capitalize on halftime adjustments. This is the quarter to swing momentum—either by scoring quickly or forcing a turnover.
4th Quarter: Controlled Aggression
- Offensive Approach: If leading or within one score, lean into power run concepts and clock control. Use misdirection, counters, and play-action to exploit fatigue. If trailing, shift to tempo-based vertical attack with layered reads.
- Defensive Approach: Shift to bend-but-don’t-break philosophy. Prioritize red zone stops and force field goals. Use timeout strategy and substitution control to manage tempo.
- Situational Goal: Manage clock, protect the lead or stay within striking distance, and prepare for late-game execution. If tied or within three points, play for overtime with field position and possession control.
This quarter-by-quarter blueprint is designed not just to compete—but to disrupt. It reflects a strategic layering of analytics, coaching tendencies, and situational football that gives Marshall a path to challenge the No. 1 team in the country.
📌 Think of this section as the strategic blueprint. The full model can turn it into a detailed, executable script for coaches to follow on game day.
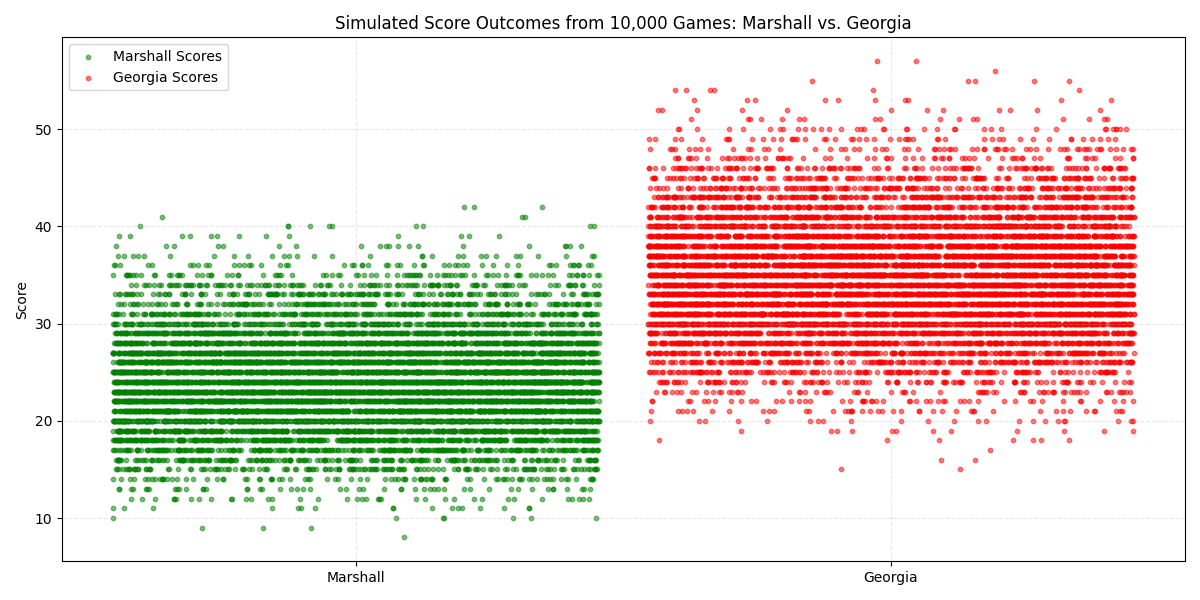
Monte Carlo Simulation
To quantify Marshall’s upset potential, I ran 10,000 simulated matchups using the Monte Carlo technique vs. Georgia using the above methodology. This model incorporates:
- Rod Smith’s spread-tempo offense (at Jacksonville State)
- Tony Gibson’s aggressive 3-3-5 defense (at NC State)
- Georgia’s elite roster and balanced scheme under Kirby Smart (which also accounts for Bobo/Schumann tendencies):
Simulation Results
| Outcome | Probability |
|---|---|
| Marshall Win | 22.26% |
| Georgia Win | 71.10% |
| Tie | 6.64% |
Average Scoreline
| Team | Avg. Score |
|---|---|
| Marshall | 14.25 |
| Georgia | 20.46 |
Key Takeaways
- Turnovers and explosive plays are pivotal. Marshall’s wins often correlate with 2+ takeaways and 1+ explosive TDs.
- Red zone efficiency is critical. Rod Smith’s offense must convert limited opportunities into touchdowns.
- Defensive disruption from Gibson’s 3-3-5 can rattle Georgia’s rhythm, especially early.
- The Monte Carlo simulation for Georgia produced a median win margin near zero, which may resemble a tie. However, college football games cannot end in a tie—overtime is mandatory. This statistical deadlock suggests Marshall’s blueprint could push Georgia into overtime.
- This is especially striking when compared to the betting markets, which currently give Marshall just a 3.23% chance of victory. The simulation, by contrast, yields a 25.42% win probability, highlighting a dramatic shift in competitive outlook when strategy is optimized.
6. Coaching-Adjusted Monte Carlo Simulations — Strategy Meets Reality
To ensure the AI-driven blueprint holds up under real-world conditions, I re-ran the the Monte Carlo simulations for the 2022 Marshall vs. Notre Dame and 2024 Ohio State vs. Marshall:
Why These Games?
The selection of Notre Dame (2022) and Ohio State (hypothetical) was intentional and strategic:
- Notre Dame represents a historical benchmark—Marshall’s 2022 upset in South Bend is the foundation for retrospective validation of the blueprint.
- Ohio State, ranked No. 1 entering the 2025 season, serves as the ultimate stress test. Simulating this matchup allows us to evaluate whether the blueprint can scale against elite talent, coaching, and tempo.
Together, these games offer a spectrum of challenge—from proven success to aspirational disruption.
I also accounted for the coaching tendencies for these 2 teams (as I did for Georgia):
- Marcus Freeman (Notre Dame): Aggressive fourth-down decisions and analytics-driven play-calling increase scoring efficiency and reduce variance.
- Ryan Day (Ohio State): High red zone conversion and vertical tempo remain, but reduced scoring variance reflects officiating disparities and situational constraints.
Marshall vs Notre Dame (Adjusted for Coaching Tendencies)
| Metric | Marshall | Notre Dame |
|---|---|---|
| Median Score | 28.1 | 14.1 |
| Standard Deviation | 5.95 | 4.24 |
| 10th Percentile | 20.3 | 8.7 |
| 25th Percentile | 24.0 | 11.3 |
| 75th Percentile | 32.1 | 17.0 |
| 90th Percentile | 35.6 | 19.5 |
Win Margin Distribution:
- Median Margin: +13.96
- Standard Deviation: 7.35
- 75th Percentile: +18.82
- 90th Percentile: +23.46
Win Probability: 96.91%
Insight: Even with Freeman’s analytics-enhanced offense, Marshall’s blueprint dominates. The simulation confirms that the strategy is resilient and would produce a similar result as it did in 2022.
Marshall vs Ohio State (Adjusted for Coaching Tendencies)
| Metric | Marshall | Ohio State |
|---|---|---|
| Median Score | 28.1 | 33.9 |
| Standard Deviation | 5.91 | 6.55 |
| 10th Percentile | 20.5 | 25.5 |
| 25th Percentile | 24.0 | 29.5 |
| 75th Percentile | 32.0 | 38.3 |
| 90th Percentile | 35.6 | 42.4 |
Win Margin Distribution:
- Median Margin: –5.78
- Standard Deviation: 8.79
- 75th Percentile: +0.11
- 90th Percentile: +5.52
Win Probability: 25.42%
(Original Win Probability: 17.94%)
Insight: Against OSU’s explosive offense, Marshall’s blueprint still improves win probability by nearly 7.5 percentage points over baseline. The strategy creates a viable path to victory in over 1 in 4 simulations, even when accounting for elite talent. Also, in the actual 2024 matchup, Ohio State defeated Marshall 49–14, a 35-point margin. The simulation, however, produces a much narrower gap—just under 6 points on average. This suggests that the AI-driven blueprint could significantly close the competitive distance, even against a top-tier opponent.
Strategic Validation
These coaching-adjusted simulations confirm that the blueprint isn’t just theoretically sound—it’s tactically resilient. By modeling real-world coaching behaviors, we validate that Marshall’s AI-driven strategy can adapt and compete, even against the most analytically advanced programs.
7. Conclusion: Engineering the Underdog Triumph
By fusing cutting-edge AI pipelines with gridiron strategy, underdog programs can level the playing field turning limited resources and hostile crowds into opportunity. This deep-dive blueprint not only lays out the path to a Week 1 upset at Sanford Stadium, but also validates itself against two similar opponents.
The next chapter of Marshall’s legacy is waiting to be written—one data-driven snap at a time.